
Two numbers landed within days of each other at the end of August, and they do not agree.
The first was 7.8%. India’s real GDP growth for April to June, the fastest of any major economy, comfortably ahead of the Reserve Bank’s 7% forecast and the 7.1% the market expected. The second was 52.8. The manufacturing PMI for August, the weakest factory expansion in five years, the lowest reading since August 2021.
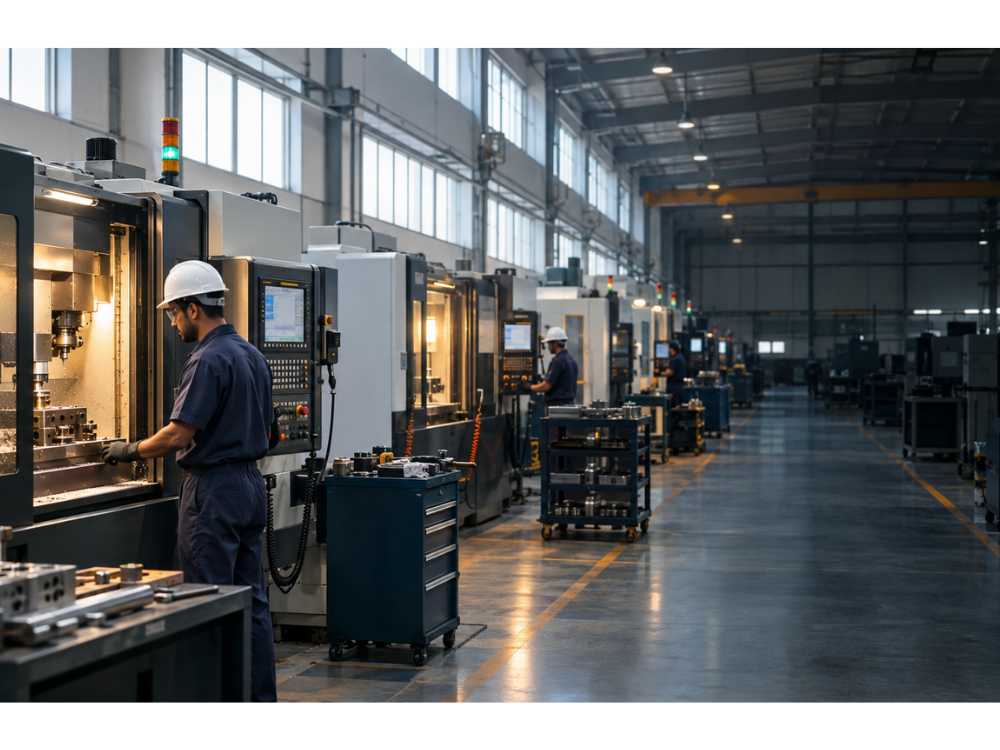
Both are real. The interesting question is which one describes the shop floor.
The honest answer is that the headline is an upper bound, lifted by a change of method, a very soft price deflator and a narrow band of sectors, while the volume data underneath it shows something more modest: factories growing at mid-single digits, busy in some lines and idle in others, and losing momentum by the time the quarter closed.
Start with the number everyone quoted
Real GDP grew 7.8% to reach ₹81.36 lakh crore. Nominal GDP, which is output measured at actual prices before any inflation adjustment, grew 10.3% to ₹88.27 lakh crore. Real gross value added, the production-side measure, grew even faster at 8.2%. Services led at 10%, with financial, real estate and IT services up 12.1%, and capital investment rose 11.9%. On its own terms it is a strong quarter after an oil shock and a messy global backdrop.
Then look at the gap between the two growth rates. Real at 7.8% and nominal at 10.3% imply that prices across the whole economy rose only about 2.3%. That is below CPI inflation of around 3.9% and far below wholesale inflation, which was running near 9%. When the deflator, the price adjustment that turns nominal into real, is that soft, it does a lot of the lifting.
This is where the argument that broke out this week comes from.
Former finance secretary Subhash Chandra Garg said the real growth number was not 7.8% but 2.6%. His method was to compare this year’s nominal figure of ₹88.3 lakh crore against last year’s originally reported ₹86.1 lakh crore, which produces a growth of roughly 2.6%. The problem is that the two numbers come from different series. In February, MoSPI rebased the national accounts to 2022-23 from 2011-12, and in doing so revised last year’s Q1 nominal GDP down to ₹80.0 lakh crore. Compare like with like, ₹88.3 lakh crore against ₹80.0 lakh crore, and nominal growth is 9.7%.
Even SBI’s research team, defending the number, conceded the point that matters. In its own reconstruction, adjusting the deflator on a comparable basis, real growth works out closer to 7.4% rather than the printed 7.8%. It called Garg’s approach a mixing of series and worse, but its own honest figure still shaved the headline. The government’s FAQ made a fair counterpoint too: the statistical discrepancy this quarter was negative, and stripping it out would have pushed the expenditure-side number higher, not lower, so the discrepancy was holding the print down rather than inflating it.
Both things are true at once. The official methodology is internally consistent, and the revision plus a thin deflator still flatter the printed rate. Treat 7.8% as the ceiling, and something in the mid-sevens as the more defensible read of how fast the economy actually expanded.
Manufacturing was sold as the bright spot
Official real manufacturing GVA grew 9.2%, up from 8.3% a year earlier, and it did much of the work pulling the secondary sector to 8.6%.
That 9.2% carries the same twist as the headline, only sharper. Nominal manufacturing GVA grew just 7.7%. Real grew 9.2%. The implied price deflator for manufacturing was therefore negative, around minus one and a half per cent. MoSPI’s explanation is legitimate and worth understanding rather than dismissing. Under the new double-deflation method, output and inputs are deflated separately, and when input prices rise faster than output prices, real value added can grow faster than nominal even though nothing about it feels like deflation on the ground.
It is allowed. It also means 9.2% overstates how much extra value factories created after paying sharply more for oil, metals, chemicals and cotton. ICRA had pencilled in manufacturing GVA nearer 6% for exactly this reason.
So look at volume instead, because volume does not care about deflators.
The Index of Industrial Production measures how much was physically produced, and manufacturing is roughly 78% of it. Manufacturing IIP grew 7.3% in July, with the overall index up 6.7%, and across the quarter the manufacturing reading ran closer to 6 to 6.5%. When the value-added print and the volume print diverge this much, the volume print is the more reliable description of the factory. That puts real manufacturing expansion at around six per cent, respectable, but not nine.
What the floor actually shows
Underneath the aggregate, the picture is uneven in ways the single number hides.
The core is two economies moving in opposite directions. The Index of Core Industries grew 5.4% in July and 4.3% across April to July, a real improvement on the 1.5% of a year earlier. But the composition is stark. Iron ore rose 29.5%, cement 13.1%, electricity 9% and steel 2.9%, all the infrastructure and construction materials moving hard. Against them, crude oil fell 5.3%, natural gas 3.7% and fertiliser 8%. Energy extraction is contracting while the materials that go into roads, plants and buildings are surging. The economy is building, not drilling.
Capacity is busy, not stretched. Capacity utilisation, on the RBI’s survey, sits around 77.4%, up from 75.6% and above the long-run average near 73.7%. Plants are running warmer than usual. They are not maxed out, which means there is still room to lift output before anyone has to pour concrete for a new line.
Listed factories sold more, and this time kept the margin. Across roughly 1,827 listed private manufacturers, sales rose 21.4% and operating profit rose 21.3%, holding the operating margin at 14.7% against 13.8% a year earlier, even as raw-material costs jumped 27.5%. That is genuine revenue growth with margins intact at the larger, listed end of the base, led by autos, petroleum and electrical machinery. It is also uneven beneath the average. Oil marketing companies lost money, and some of the metals profit came from higher prices rather than more tonnes.
And the momentum did not hold. The PMI was 54.7 in April and 55.0 in May. By August it had fallen for a third straight month to 52.8, the weakest expansion in five years. Output growth was the slowest since 2021, new orders grew at their weakest pace in five years, and factory employment slipped into a mild contraction, the first decline in two and a half years. The sector is still expanding. The Q1 bounce simply did not carry into the second quarter.
The part the headline never captures
Two structural facts sit behind all of this.
The first is jobs. The production-linked incentive schemes have pulled in about ₹2.4 lakh crore of investment and created somewhere near 1.4 to 1.45 million direct and indirect jobs, with scheme-linked exports climbing to around ₹15.2 lakh crore. Electronics, phones and components, is the clear multi-year success. But that is concentrated and cumulative, built over several years, not a sudden nationwide hiring wave in one quarter. The labour-intensive base, textiles, apparel and leather, has been flat or shrinking for years. Manufacturing is still only about 12 to 13% of GDP, nowhere near the 25% that Make in India set as its target a decade ago. The PMI dipping into job losses is the number to watch here, because this is the part of the economy that was supposed to absorb people leaving farms.
The second is trade, and it echoes a pattern worth naming. July produced record merchandise exports of $44.24 billion, up nearly 20%, with electronics and engineering goods genuinely reshaping the export basket away from commodities. In the same month imports were $76.22 billion, and the merchandise trade deficit widened to $31.98 billion. Across April to July the deficit widened to $118.6 billion from $96.66 billion a year earlier, because imports grew faster than exports. A large part of the manufacturing story is still assembly that runs on imported components and imported machinery. The factories are busier, and so are the ships bringing in what they run on.
The compressed verdict
The economy grew in the June quarter. It did not seize up under a higher oil price and a difficult external backdrop. That much is true and worth saying plainly, because the opposite claim, that there was no growth at all, is as wrong as the triumphalism.
But 7.8% GDP and 9.2% manufacturing GVA are the official ceiling, not the room. They are lifted by a rebasing that lowered last year’s base, by a deflator so soft it turned negative inside manufacturing, and by a narrow set of sectors doing the heavy lifting. On a comparable basis the growth is closer to the mid-sevens, manufacturing volume is running at six to seven per cent, listed-firm sales are up around 20% but cost-pressed and uneven, factories are busy in infrastructure materials and autos and electricals rather than across the labour-intensive base, and the momentum was already fading by August.
If you want to know whether Indian manufacturing is actually flourishing, the headline GVA print is the last place to look. Watch the IIP, the core industries split, PMI new orders, the raw-material ratios in company results, and the volume readings for the labour-intensive groups. Right now those say the same thing in unison.
The sector is growing in pockets. It is not yet a broad factory-floor takeoff, and the quarter that produced the best growth number in the world is also the quarter its factories grew the slowest in five years. Both numbers are real. Only one of them is the shop floor.
Data sources: MoSPI (Q1 FY27 National Accounts, new 2022-23 series; IIP July 2026), Office of the Economic Adviser DPIIT (Index of Core Industries, July 2026), RBI (OBICUS capacity utilisation; listed manufacturing company finances), HSBC/S&P Global (Manufacturing PMI, August 2026), Ministry of Commerce & Industry (merchandise trade, July and April-July FY27), SBI Ecowrap, and MoSPI clarificatory FAQs.